
Page 28 - Beverage MasterAug Sept 2020_Rev
P. 28
Craft Brewery
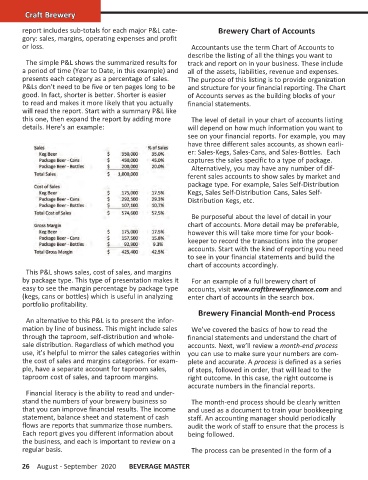
report includes sub-totals for each major P&L cate- Brewery Chart of Accounts
gory: sales, margins, operating expenses and profit
or loss. Accountants use the term Chart of Accounts to
describe the listing of all the things you want to
The simple P&L shows the summarized results for track and report on in your business. These include
a period of time (Year to Date, in this example) and all of the assets, liabilities, revenue and expenses.
presents each category as a percentage of sales. The purpose of this listing is to provide organization
P&Ls don’t need to be five or ten pages long to be and structure for your financial reporting. The Chart
good. In fact, shorter is better. Shorter is easier of Accounts serves as the building blocks of your
to read and makes it more likely that you actually financial statements.
will read the report. Start with a summary P&L like
this one, then expand the report by adding more The level of detail in your chart of accounts listing
details. Here’s an example: will depend on how much information you want to
see on your financial reports. For example, you may
have three different sales accounts, as shown earli-
er: Sales-Kegs, Sales-Cans, and Sales-Bottles. Each
captures the sales specific to a type of package.
Alternatively, you may have any number of dif-
ferent sales accounts to show sales by market and
package type. For example, Sales Self-Distribution
Kegs, Sales Self-Distribution Cans, Sales Self-
Distribution Kegs, etc.
Be purposeful about the level of detail in your
chart of accounts. More detail may be preferable,
however this will take more time for your book-
keeper to record the transactions into the proper
accounts. Start with the kind of reporting you need
to see in your financial statements and build the
chart of accounts accordingly.
This P&L shows sales, cost of sales, and margins
by package type. This type of presentation makes it For an example of a full brewery chart of
easy to see the margin percentage by package type accounts, visit www.craftbreweryfinance.com and
(kegs, cans or bottles) which is useful in analyzing enter chart of accounts in the search box.
portfolio profitability.
Brewery Financial Month-end Process
An alternative to this P&L is to present the infor-
mation by line of business. This might include sales We’ve covered the basics of how to read the
through the taproom, self-distribution and whole- financial statements and understand the chart of
sale distribution. Regardless of which method you accounts. Next, we’ll review a month-end process
use, it’s helpful to mirror the sales categories within you can use to make sure your numbers are com-
the cost of sales and margins categories. For exam- plete and accurate. A process is defined as a series
ple, have a separate account for taproom sales, of steps, followed in order, that will lead to the
taproom cost of sales, and taproom margins. right outcome. In this case, the right outcome is
accurate numbers in the financial reports.
Financial literacy is the ability to read and under-
stand the numbers of your brewery business so The month-end process should be clearly written
that you can improve financial results. The income and used as a document to train your bookkeeping
statement, balance sheet and statement of cash staff. An accounting manager should periodically
flows are reports that summarize those numbers. audit the work of staff to ensure that the process is
Each report gives you different information about being followed.
the business, and each is important to review on a
regular basis. The process can be presented in the form of a
26 August - September 2020 BEVERAGE MASTER
BM080920 Main Pages .indd 26 7/17/20 2:30 PM